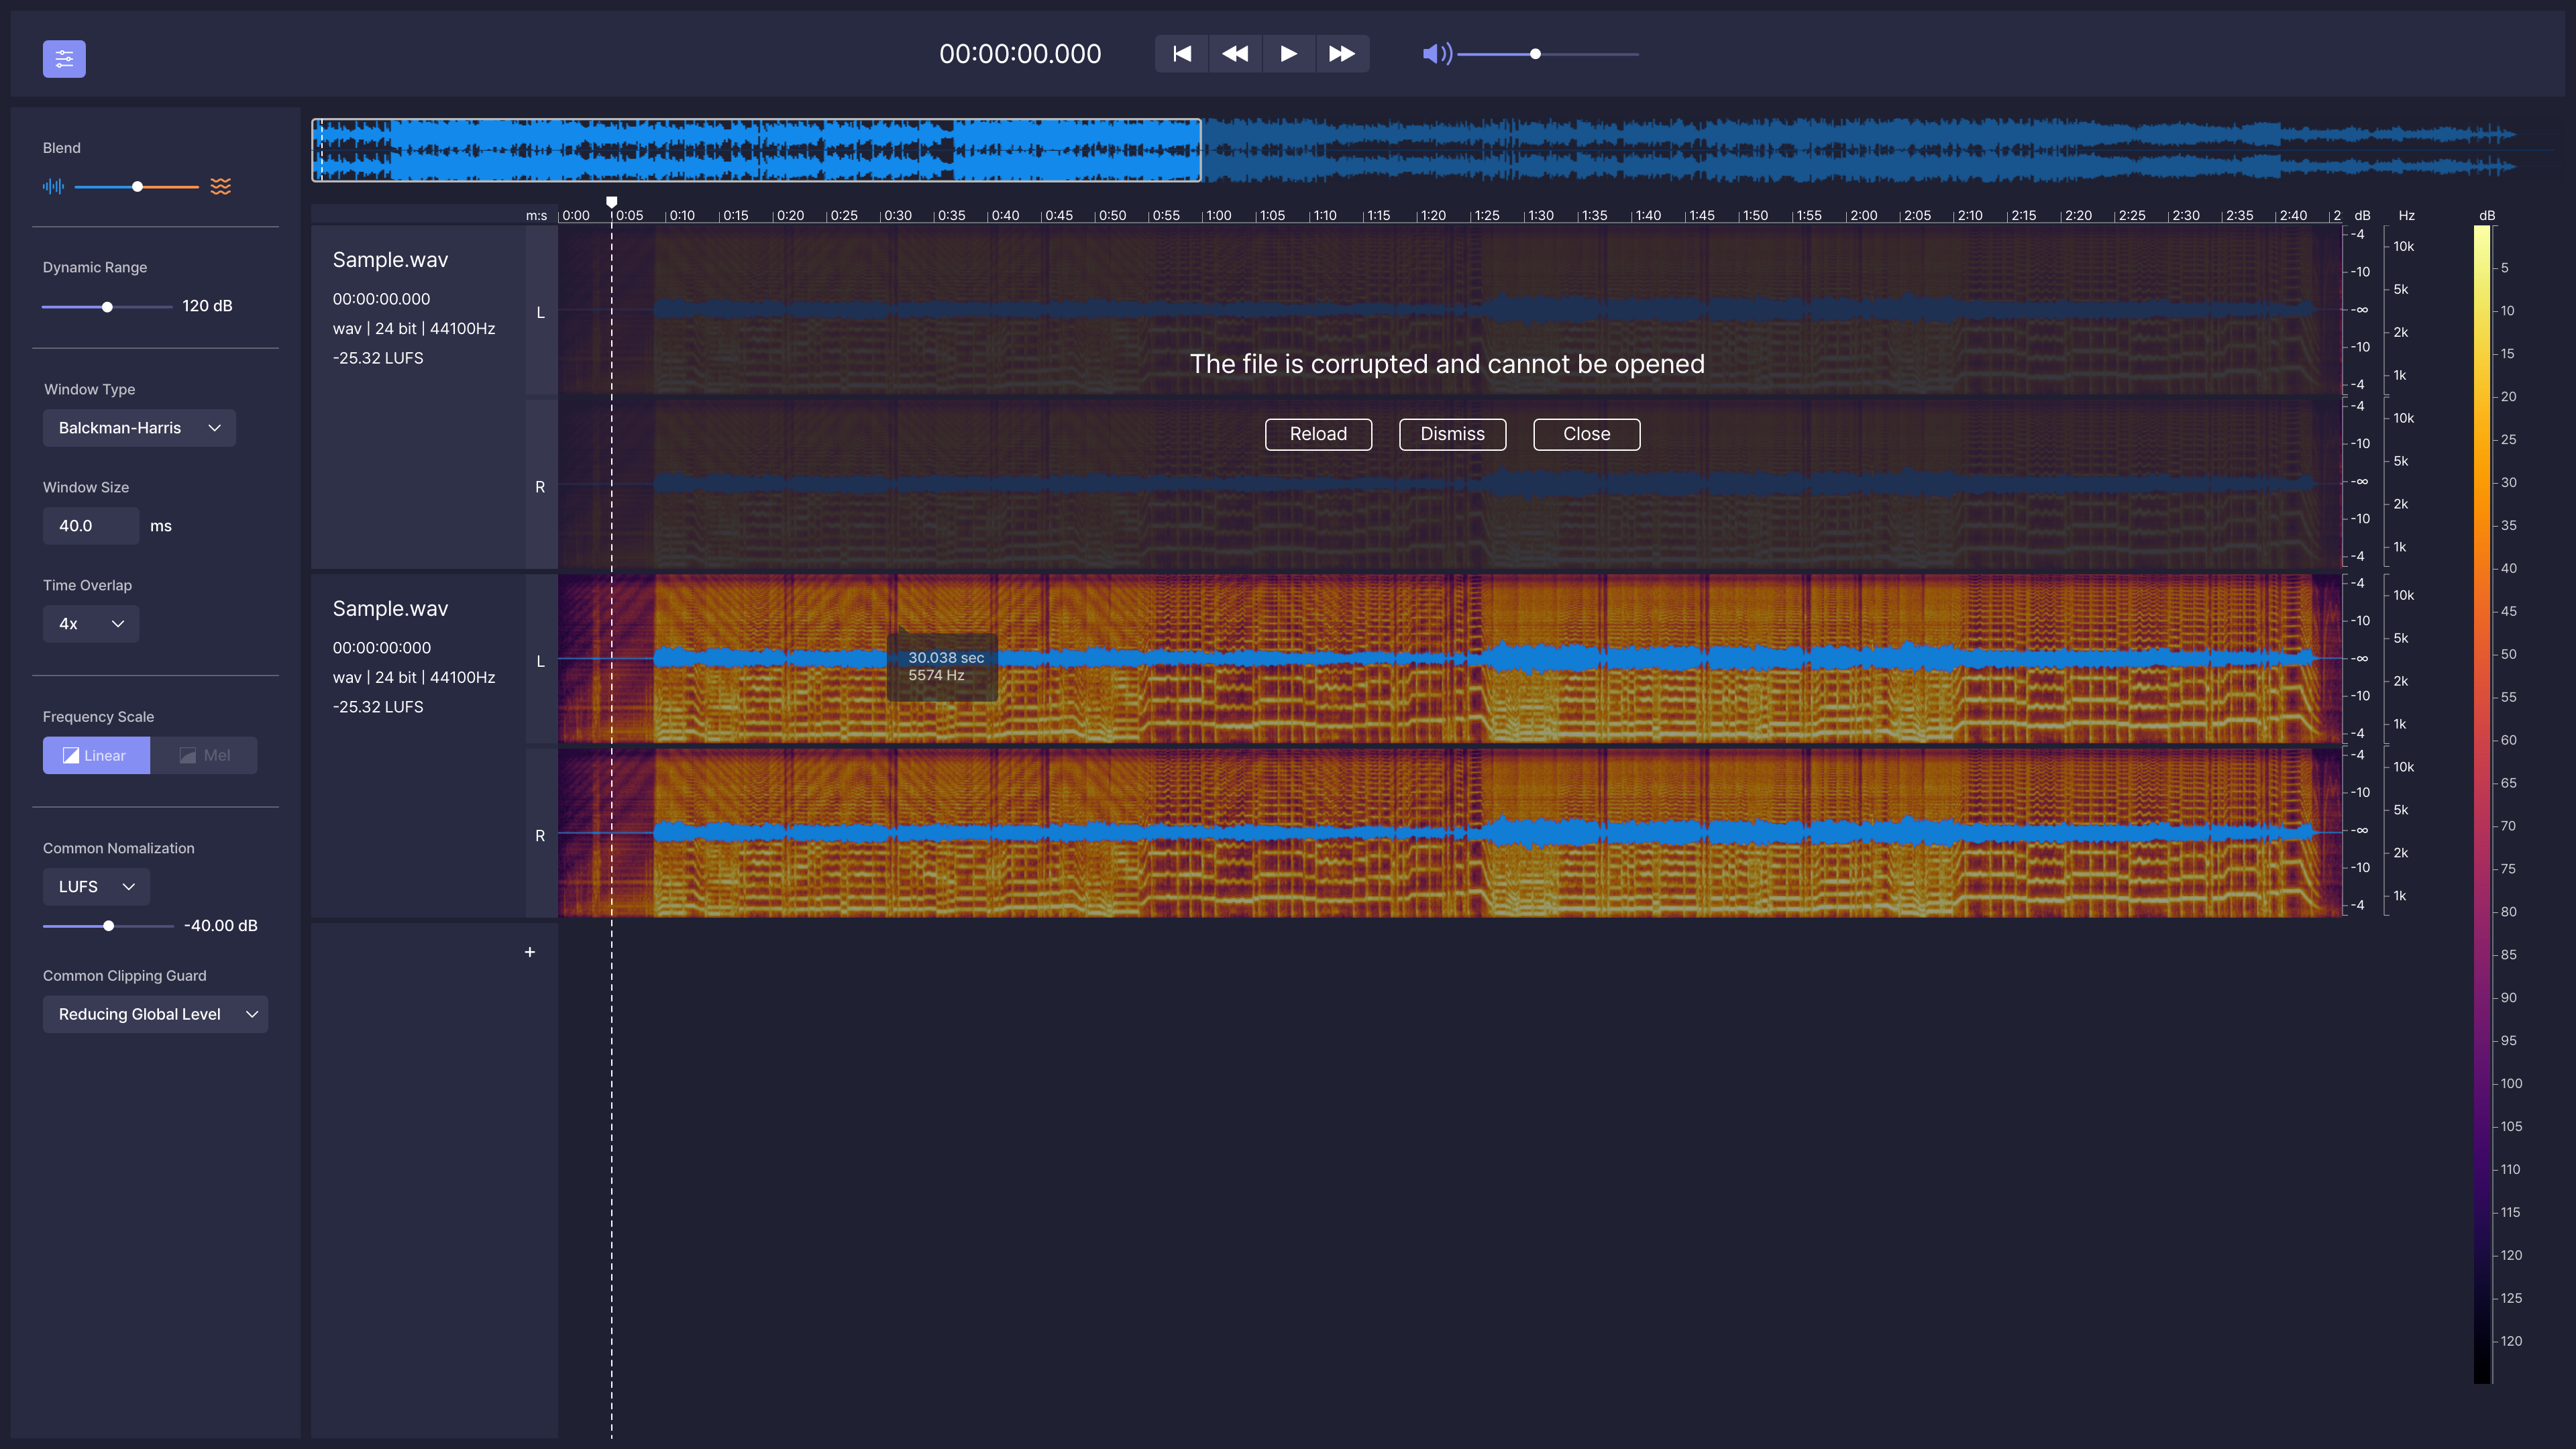
A vertical multitrack spectrum comparison panel component designed for foobar2000, suitable for the default UI (DUI).
Features:
Configuration persistence: Panel settings are serialized using the .fth format.
Floating panel: Supports use as an independent floating panel, which can be opened through the main menu “View” (hold Shift to show hidden menu items).
Vertical multi-track comparison: Select multiple audio tracks and divide them vertically into equal sections. Up to 4 audio tracks can be compared simultaneously to show frequency characteristics.
Background thread analysis: Each audio track is decoded and analyzed in an independent thread, without blocking the UI. Analysis begins immediately upon selection, with loading in seconds.
Spek-style color schemes: 3 built-in color palettes—Spectrum (Spek’s classic rainbow), SoX, and Mono (monochrome).
Frequency axis labeling: The left side displays a linear frequency scale of 0–22 kHz, which can be toggled in the right-click menu.
Timeline markings: The bottom displays time scales at 20-second intervals, which can be toggled in the right-click menu.
Custom title format: Supports foobar2000 titleformat syntax for custom track tags, displayed by default %title% | %codec% | %bitrate% kbps[ | $info(bitspersample) bit] | %samplerate% Hz | $info(channels) CH | %path%. Right-click to edit the format and press Enter to confirm; the spectrum will not be reloaded.
DPI-aware: Correctly scales on high-resolution screens such as 4K, with spacing, fonts, and axes all adapting automatically.
Double-buffered rendering: The overall image is output with double buffering, resulting in flicker-free switching between songs.
Bilingual interface: The right-click menu supports one-click switching between Chinese and English, and the language setting is persistent with the panel configuration.
Bitfake was originally created to detect fake .FLAC files through spectral analysis. It has since grown into a multipurpose CLI tool for handling music more easily and efficiently.
One common problem was that getting a track’s metadata required long ffprobe commands with messy output. Converting music with ffmpeg was also repetitive. The command itself is easy to remember, but writing scripts to convert entire directories felt inefficient and slow. This project now performs metadata and conversion tasks directly through linked libraries (TagLib/libsndfile/libav*).
Features:
Get metadata
Get ReplayGain info (useful for music players)
Spectral analysis on 44.1 kHz .FLAC files (higher sample rates may be misrepresented, so be careful)
Lossy diagnosis (banding score)
File Conversion + VBR Support (Works for outputs like .wav, .flac, .ogg, .mp3, .aac, .opus)
Tagging metadata (Works for single files, but not directories yet)
Calculating ReplayGain and applying it to files (Works for track replay gain iterating through directories, album replay gain is a bit funky?)
Directory Conversion (works for all previously mentioned formats!)
CoverArt+ (Brings along cover art among all conversions!)
Organizing Files by album! (Give a dir of random music, and bitfake will organize it – ty to uncognic)
Directory Tagging (YAY!)
Album folder renaming from tags (Artist – Album (Year))
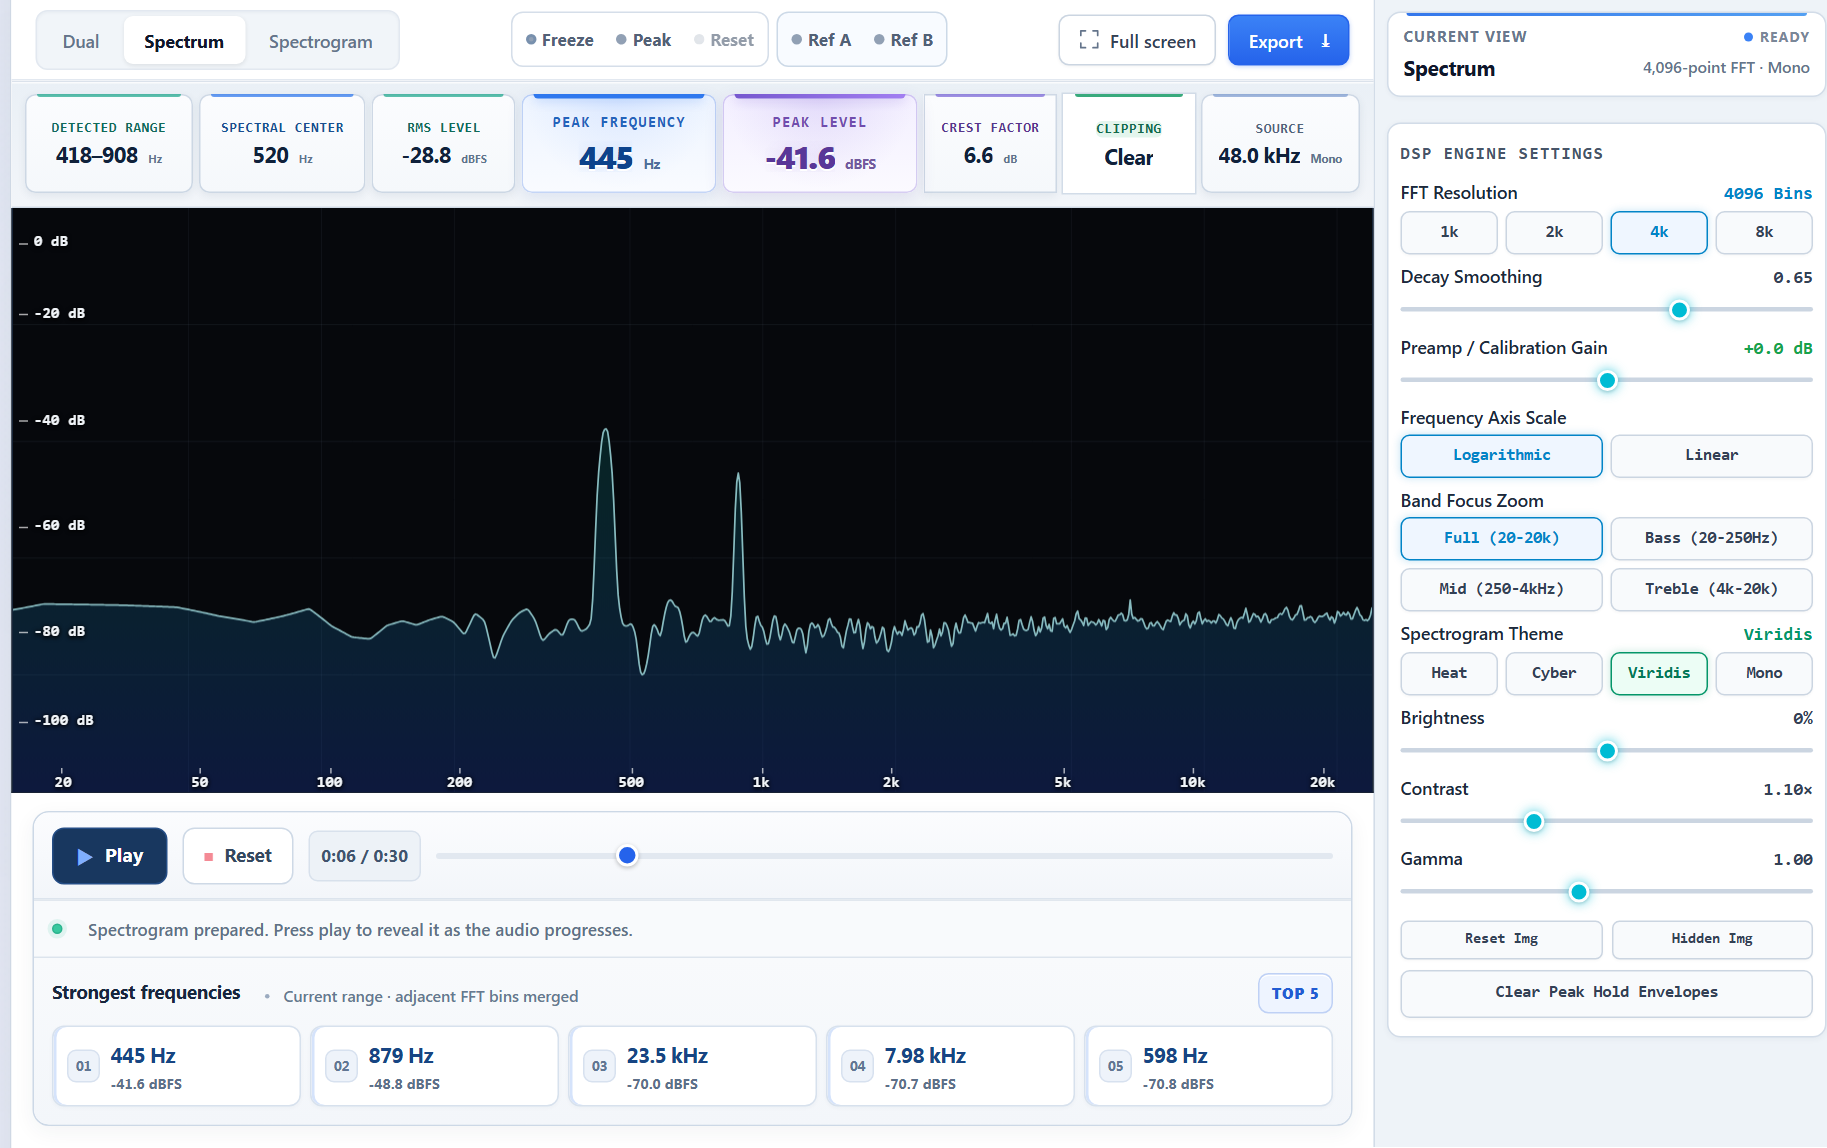
foo_vis_spectrum_analyzer is a foobar2000 component that implements a spectrum analyzer panel. It is an attempt to recreate the foo_musical_spectrum component by fismineur for foobar2000 64-bit.
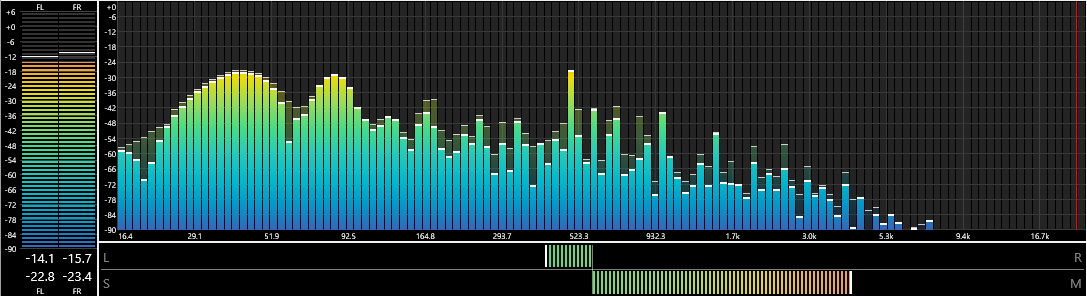
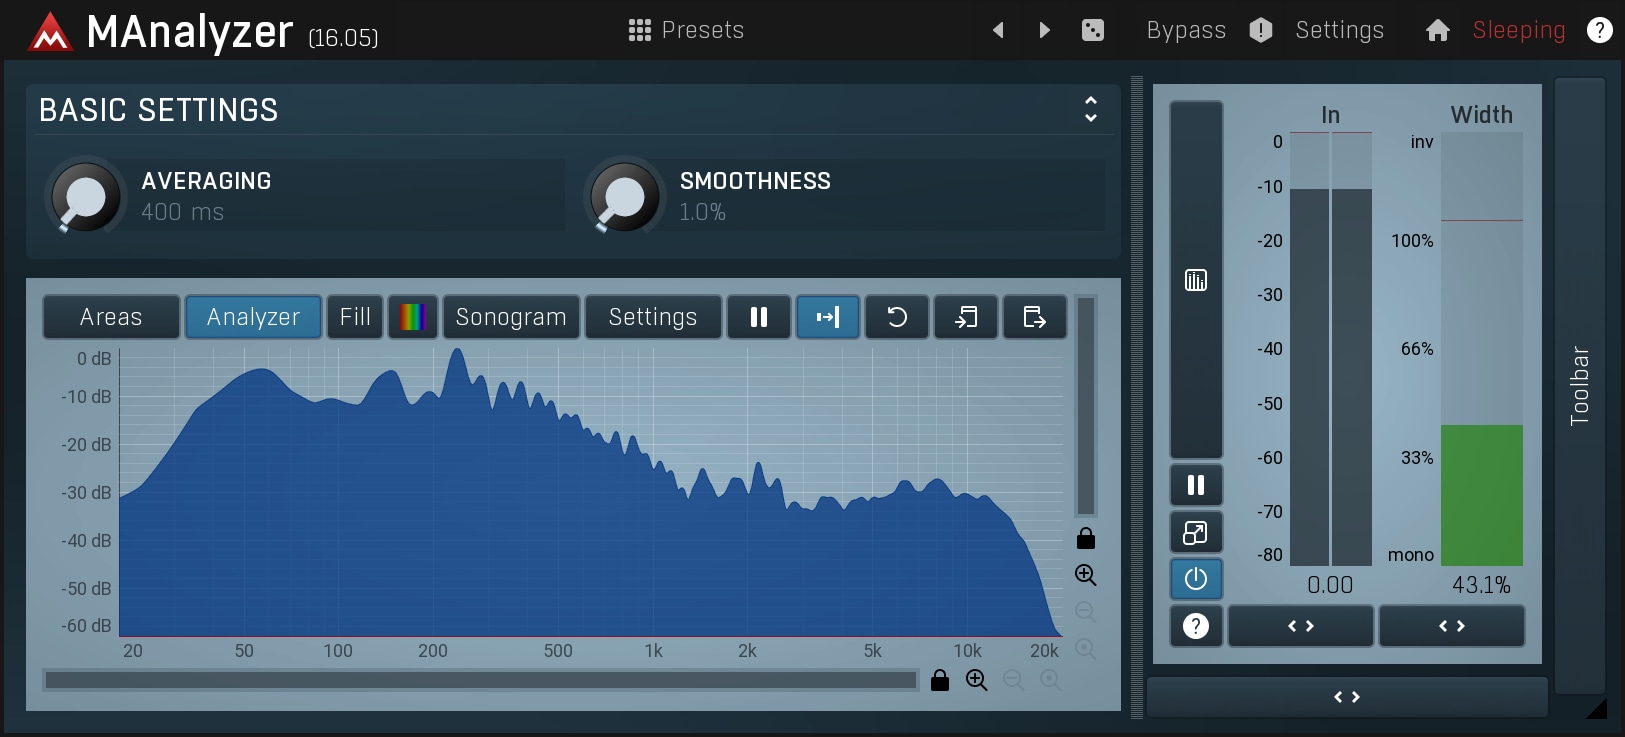
MAnalyzer is an advanced spectral analyzer and sonogram plugin containing unique features such as smoothing, normalization, super-resolution, prefiltering and deharmonization. The included meters provide a peak meter and EBU R128 and ITU-R BS 1770-3 compliant loudness meter.
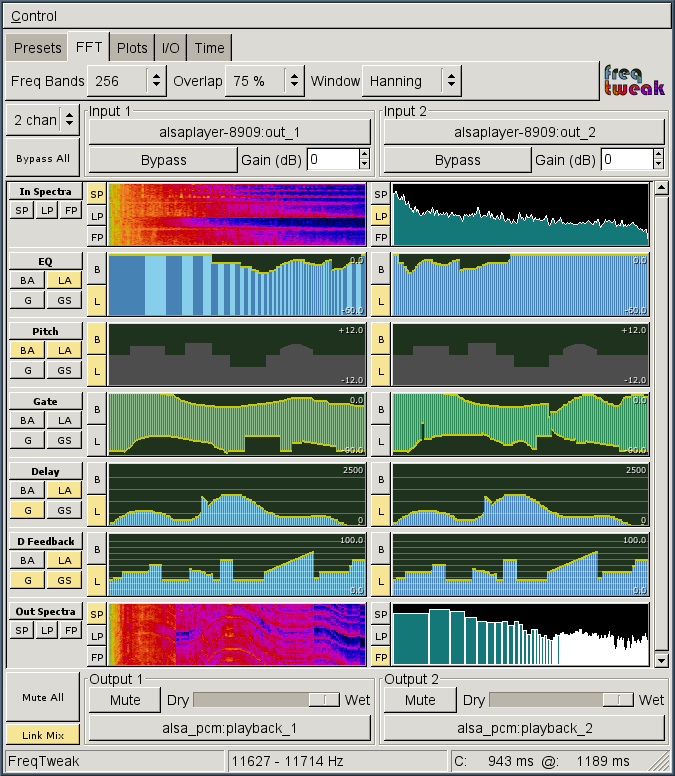
FreqTweak is a tool for FFT-based realtime audio spectral manipulation and display. It provides several algorithms for processing audio data in the frequency domain and a highly interactive GUI to manipulate the associated filters for each. It also provides high-resolution spectral displays in the form of scrolling-raster spectrograms and energy vs frequency plots displaying both pre- and post-processed spectra.
It is an extremely addictive audio toy, but I hope it has value for serious audio work too (sound design, etc). The spectrum analysis is pretty useful in its own right.
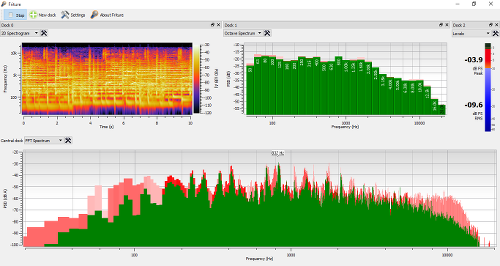
Friture is an application to visualize and analyze live audio data in real-time. Friture displays audio data in several widgets, such as a scope, a spectrum analyzer, or a rolling 2D spectrogram.
This program can be useful to analyze and equalize the audio response of a hall, or for educational purposes, etc.
The name Friture is a french word for frying, also used for noise in a sound.
Friture helps you to understand audio data with several widgets:
DeaDBeeF (as in 0xDEADBEEF) is a modular audio player for GNU/Linux, *BSD, OpenSolaris, macOS, and other UNIX-like systems.
DeaDBeeF lets you play variety of audio formats, convert between them, customize the UI almost any way you want, and use many additional plugins which can extend it even more.