foo_spectrum_compare ~ Multispectrogram Comparison


A vertical multitrack spectrum comparison panel component designed for foobar2000, suitable for the default UI (DUI).

Features:

Configuration persistence: Panel settings are serialized using the .fth format.

Floating panel: Supports use as an independent floating panel, which can be opened through the main menu “View” (hold Shift to show hidden menu items).

Vertical multi-track comparison: Select multiple audio tracks and divide them vertically into equal sections. Up to 4 audio tracks can be compared simultaneously to show frequency characteristics.

Background thread analysis: Each audio track is decoded and analyzed in an independent thread, without blocking the UI. Analysis begins immediately upon selection, with loading in seconds.

Spek-style color schemes: 3 built-in color palettes—Spectrum (Spek’s classic rainbow), SoX, and Mono (monochrome).

Frequency axis labeling: The left side displays a linear frequency scale of 0–22 kHz, which can be toggled in the right-click menu.

Timeline markings: The bottom displays time scales at 20-second intervals, which can be toggled in the right-click menu.

Custom title format: Supports foobar2000 titleformat syntax for custom track tags, displayed by default %title% | %codec% | %bitrate% kbps[ | $info(bitspersample) bit] | %samplerate% Hz | $info(channels) CH | %path%. Right-click to edit the format and press Enter to confirm; the spectrum will not be reloaded.

DPI-aware: Correctly scales on high-resolution screens such as 4K, with spacing, fonts, and axes all adapting automatically.

Double-buffered rendering: The overall image is output with double buffering, resulting in flicker-free switching between songs.

Bilingual interface: The right-click menu supports one-click switching between Chinese and English, and the language setting is persistent with the panel configuration.

foo_spectrum_compare display

github.com/a1waysbeta/foo_spectrum_compare

Tonalux Reference Comparer ~ Clientside File Comparison


Compare your mix against a reference track. Level-matched A/B with spectrum overlay and detailed metrics.

tonalux.org/comparer

Tonalux Audio Analyzer ~ Clientside Analyzation


LUFS, True Peak, BPM, Key, Stereo Width, Frequency Spectrum — everything runs locally in your browser. No uploads.

tonalux.org/analyzer

MeasureLab ~ Audio Measurement Suite


A collection of DIY audio measurement and analysis tools, grown organically as needed. This software is compatible with standard audio devices.

PyQt6 desktop app bundling 28+ DIY modules: signal generator, spectrum/PSD analyzer, sound level & LUFS meters, loopback finder, distortion/IMD tools, network/impedance analyzers, oscilloscope, spectrogram, ultrasound modulator, transient analyzer, lock-in/FRA, inverse filter, frequency counter, recorder/player, sound quality analyzer, noise profiler, boxcar averager, goniometer, BNIM meter (ITD/ILD neural map), HRTF Player, and more.

Built for hobbyists and engineers: device routing, calibration (input/output/SPL), multi-language UI, light/dark themes.

github.com/youtube-at-vach/MeasureLab
youtube-at-vach.github.io/MeasureLab

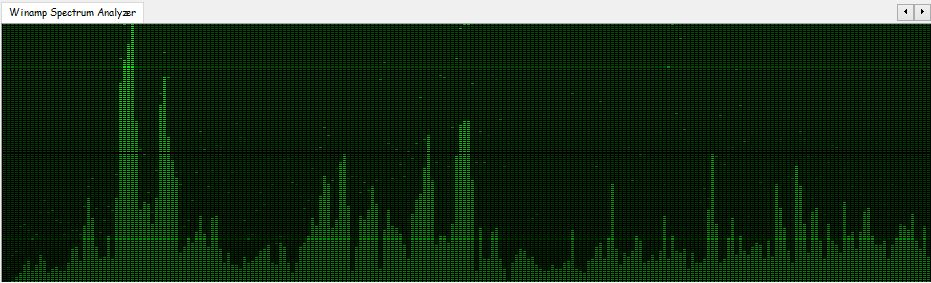
foo_vis_wispan ~ Winamp Spectrum Analyzer


foo_vis_wispan is a Foobar2000 spectrum analyzer visualization implemented with GDI. It is a port of the Classic Spectrum Analyzer (vis_classic) Winamp visualization plug-in by Mike Lynch.

Features:

  • Accurate, detailed, customizable spectrum analyzer.
  • vis_classic library has been upgraded to compile with a modern toolset.
    • Upgraded the resolution of the waveform passed into the library from 8 bits to 16 bits.
    • Other changes are mainly to integrate with foobar2000 instead of Winamp.
    • That means bugs in the original are still likely to be present.
  • Options can be modified and their effects viewed in real-time as the component is running.
  • Compatible with the Default User Interface (Default UI) and the Columns User Interface (Columns UI).
  • Tested on foobar2000 v2.25.3 (x86 32-bit and x86 64-bit) and Microsoft Windows 11 (Build 26200).

www.foobar2000.org/components/view/foo_vis_wispan
wiki.hydrogenaudio.org/…/Foobar2000_visualization_components

Resources:

en.wikipedia.org/wiki/Spectrum_analyzer

foobar2000 ~ foo_vis_spectrum_analyzer


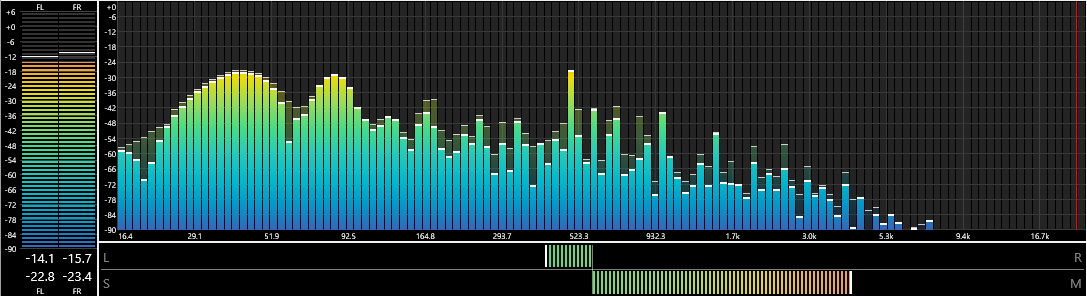
foo_vis_spectrum_analyzer is a foobar2000 component that implements a spectrum analyzer panel. It is an attempt to recreate the foo_musical_spectrum component by fismineur for foobar2000 64-bit.

hydrogenaudio.org/index.php/topic,125031.0
www.foobar2000.org/components/view/foo_vis_spectrum_analyzer
github.com/stuerp/foo_vis_spectrum_analyzer

sndpeek ~ Realtime Audio Visualizer


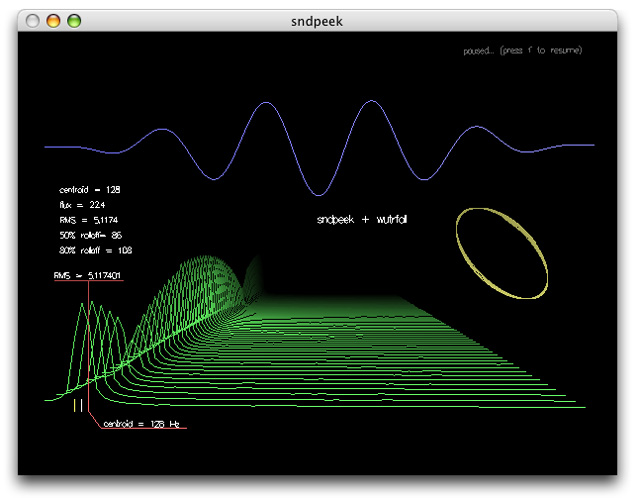
sndpeek is just what it sounds (and looks) like:

  • real-time 3D animated display/playback
  • can use mic-input or wav/aiff/snd/raw/mat file (with playback)
  • time-domain waveform
  • FFT magnitude spectrum
  • 3D waterfall plot
  • lissajous! (interchannel correlation)
  • rotatable and scalable display
  • freeze frame! (for didactic purposes)
  • real-time spectral feature extraction (centroid, rms, flux, rolloff)
  • available on MacOS X, Linux, and Windows under GPL
  • part of the sndtools distribution.

www.gewang.com/software/sndpeek
soundlab.cs.princeton.edu/software/sndpeek
www.cs.princeton.edu/sound/software/sndpeek/look

audioMotion ~ Player & Realtime Spectrum Analyzer


audioMotion is a media player and high-resolution real-time audio spectrum analyzer that allows you to SEE your music! ♪♫🤩

It is completely free, open-source software, created out of my passion for the graphic spectrum analyzers of hi-fi systems from the 1980s.

Features:

Dual channel high-resolution real-time audio spectrum analyzer

  • Media player with subtitles support for audio and video files
  • Fullscreen and Picture-In-Picture display at 60fps, ready for Retina / HiDPI screens
  • Logarithmic, linear and perceptual (Bark and Mel) frequency scales, with customizable range
  • Visualization of discrete FFT frequencies or up to 240 frequency bands (supports ANSI and equal-tempered octave bands)
  • Decibel and linear amplitude scales, with customizable sensitivity
  • Optional A, B, C, D and ITU-R 468 weighting filters
  • Optional effects: vintage LEDs, variable opacity, mirroring and reflection, radial spectrum
  • 17 beautiful color gradients, plus a visual editor to easily create your own gradients
  • Support for M3U playlists (.m3u and .m3u8 file extensions)
  • Visualize audio from your microphone (or “stereo mix”, if your soundcard supports it)

audiomotion.app
github.com/hvianna/audioMotion.js

Resources:

en.wikipedia.org/wiki/Spectrum_analyzer

GLava ~ OpenGL Audio Spectrum Visualizer


GLava is a general-purpose, highly configurable OpenGL audio spectrum visualizer for X11.

github.com/jarcode-foss/glava

Cava ~ Cross-platform Audio Visualizer


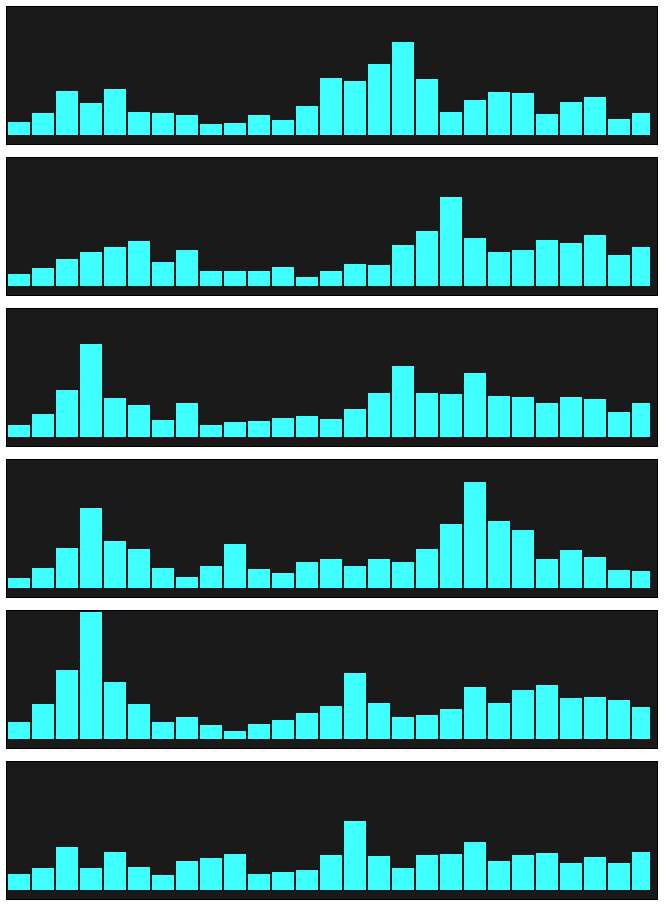
Cava is a bar spectrum audio visualizer for terminal or desktop (SDL).

Cava works on:

  • Linux
  • FreeBSD
  • macOS
  • Windows

This program is not intended for scientific use. It’s written to look responsive and aesthetic when used to visualize music.

github.com/karlstav/cava
Cavalier ~ Visualize Audio With CAVA

Online Spectrum Analyzer & Spectrogram Using Custom FFT


Resources:

en.wikipedia.org/wiki/Spectrum_analyzer

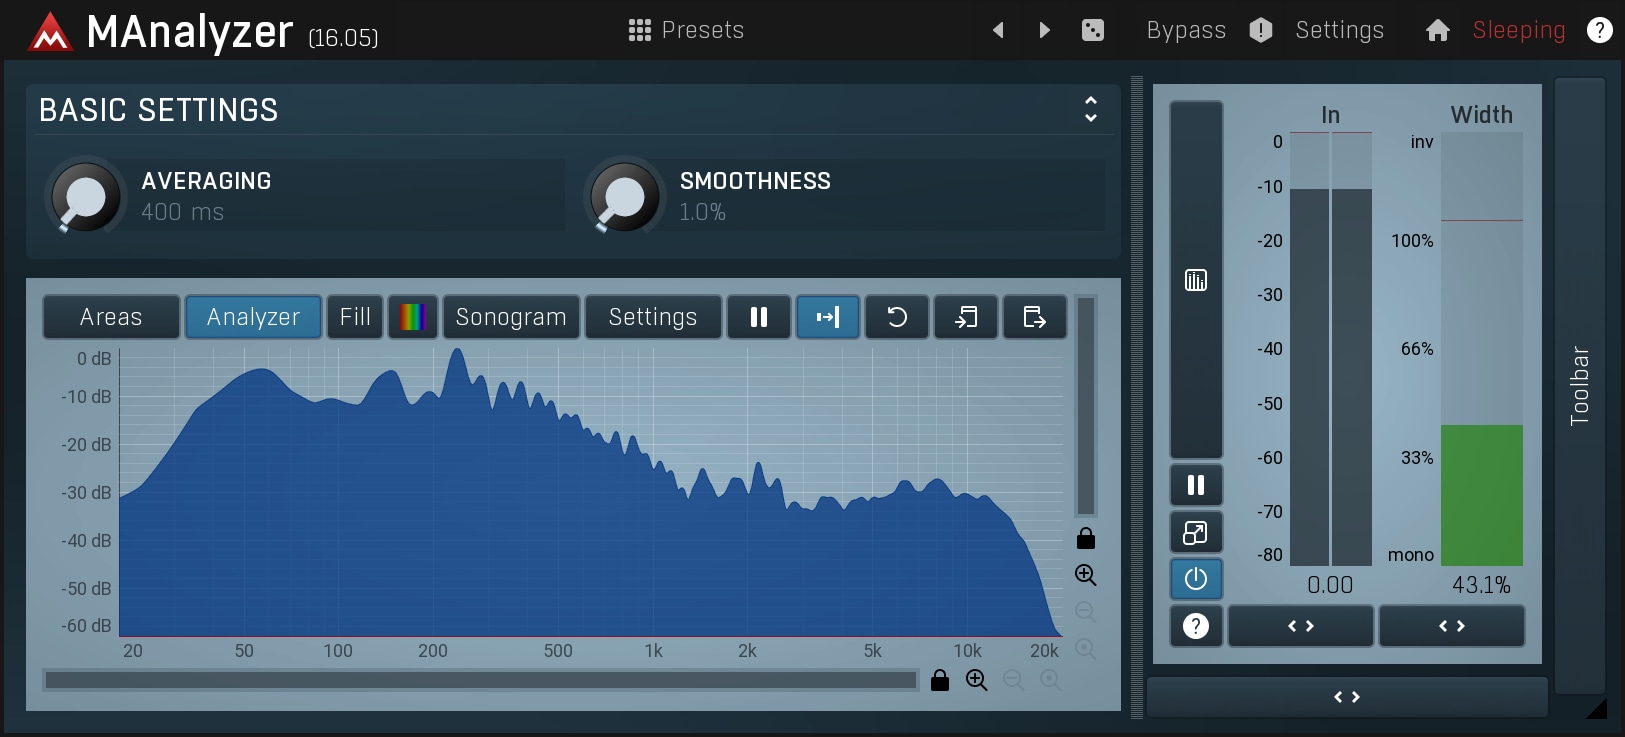
MAnalyzer ~ Normalizing Spectral Analyzer & Sonogram


MAnalyzer is an advanced spectral analyzer and sonogram plugin containing unique features such as smoothing, normalization, super-resolution, prefiltering and deharmonization. The included meters provide a peak meter and EBU R128 and ITU-R BS 1770-3 compliant loudness meter.

www.meldaproduction.com/MAnalyzer