
Raven Lite is a free cross-platform software program that lets users record, save and visualize sounds as spectrograms and waveforms. Raven Lite is intended for students, educators, and hobbyists and can be used for learning about sounds, as an aid in birdsong recognition, and in musical instruction.
Category Archives: Visual

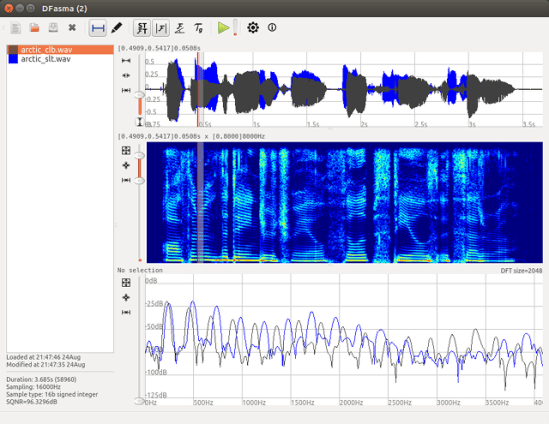
DFasma ~ Compare Audio Files In Time & Frequency
DFasma is free open-source software which is used to compare audio files in time and frequency. The comparison is first visual, using waveforms and spectra. It is also possible to listen to time-frequency segments in order to allow perceptual comparison. It is basically dedicated to analysis. Even though there are basic functionalities to align the signals in time and amplitude, this software does not aim to be an audio editor.
Features:
- Can load about 25 different audio formats (thanks to libsndfile or libsox).
- Shows spectrogram, amplitude, phase spectra and group delay.
- Can play a filtered sound given a selected frequency band.
- Rectification of the spectrogram tilt (cepstral lifting).
- Can create and edit segmentation files.
- Can create and edit fundamental frequency (F0) files (thanks to REAPER).
- Runs under Linux, Mac OSX and Windows.
gillesdegottex.github.io/dfasma
Share this:

foo_wave_seekbar ~ Foobar2000 Waveform Seekbar
Enhance the appearance and functionality of Foobar2000 by adding a visual waveform representation of the currently playing audio track, which can be used to navigate to any point in the image of the track by clicking there.
Waveform Seekbar is a UI element for both the Default UI and Columns UI that provides seekbar functionality (seeking, position indicator) on top of a pretty image of the waveform of the currently playing song, drawn using either Direct3D 9.0c or Direct2D 1.0.
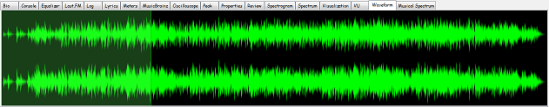
Foobar Waveform Seekbar in action
Topic ~ Hydrogen Audio
Download ~ Hydrogen Audio
Documentation ~ Hydrogen Audio
Source code ~ GitHub
Additional resources:
Waveform Minibar ~ CUI Only
Installing a foobar component
Waveform ~ Wikipedia
Share this:

Baudline ~ Visual Signal Analyzer
Baudline is a time-frequency browser designed for scientific visualization of the spectral domain. Signal analysis is performed by Fourier, correlation, and raster transforms that create colorful spectrograms with vibrant detail. Conduct test and measurement experiments with the built in function generator, or play back audio files with a multitude of effects and filters. The baudline signal analyzer combines fast digital signal processing, versatile high speed displays, and continuous capture tools for hunting down and studying elusive signal characteristics.
Explore, Analyze, and Discover.

Linux / MacOS / Unix
Website
Downloads
Twitter
Wikipedia
Baudline Mystery Signal Of The Month
Every month a new mystery signal is posted. Can you identify it?
Share this:

Spectro ~ Audio File Analyzer
Spectro is a freeware audio file analyzer for Windows. Currently capable of reading FLAC, APE, MP3 and WAV files. Spectro lets you view vital data about compressed audio files and creates a spectrogram of the wave data. This allows you to quickly and easily spot quality issues with a file and also look for transcodes.

Share this:

Audacious & XMMS ~ VU Meters Plugin
Open source, multi-instance, skinnable VU meters for Audacious and XMMS.
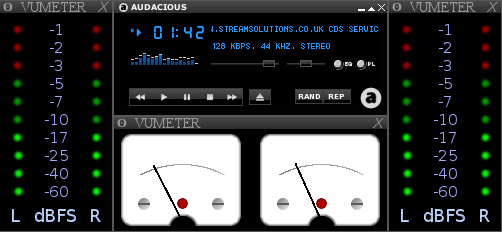
Audacious with several instances
vumeterplugin.sourceforge.net
Discussion
Downloads
Skins:
http://vumeterplugin.sourceforge.net/themes.php
http://www.gnome-look.org/content/show.php/LED+VU+meter?content=140540
Share this:

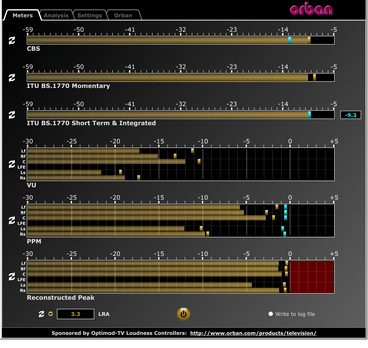
ORBAN Loudness Meter ~ Loudness & Peak Display
This software simultaneously displays instantaneous peaks, VU, PPM, CBS Technology Center loudness, and ITU BS.1770 loudness. All meters include peak-hold functionality that makes the peak indications of the meters easy to see.
The software accepts two-channel stereo inputs. The VU and PPM meters are split to indicate the left and right channels. The PPM meter also displays the instantaneous peak values of the L and R digital samples. ~ Hydrogen Audio
Share this:

Foobar2000 ~ Playlist Viewers
Foobar2000 Playlist Viewers display the current playlist of songs. Different playlist viewers offer various capabilities such as formatting, grouping and visual options. A playlist viewer is usually the central panel and main focus of a Foobar2000 interface. Foobar2000 plays the next song of the current playlist unless the play order has been changed from default, to repeat, random or shuffle. There is a playback queue but it is not visible or used in normal operation.
- Default Playlist
- EL Playlist (Extended List Playlist / Eole Playlist, CUI)
- ES Playlist (Extended Simple Playlist, DUI)
- JS Playlist (jscript playlist for WSH PANEL MOD)
- mtpl Playlist (supports folders, playlist in playlist and sub-tracks)
- SimPlaylist (multiple grouping levels, album art, etc.)

Adding a custom column to a playlist view: (using play count as an example)
- When adding a column view in a playlist, you’ll need to define the column first.
- Navigate to
Preferences > Display > Default User Interface > Playlist View > Custom Columns - at the bottom of the custom columns windows, click “
Add new‘ - Name the Column “
Played‘ and%play_count%as the ‘pattern’ - click apply, ok
- Now right click the title bar of the playlist and select “
Columns” and make sure ‘Played‘ is selected (checkmarked) and that you can see the column in the playlist, it will be last but you can rearrange it.
Resources:
Configuring the default playlist viewer
Share this:

Paul Marshall Analog Audio Level Meters
These standalone audio level meter programs allow the optimum setting of input levels for various sound recording functions, particularly for video editing.
web.archive.org/web/20130627213637/http://www.darkwooddesigns.co.uk/pc2/meter
Highly accurate PP
Share this:

VUMeter ~ Windows Analog VU Meter

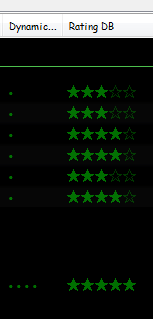
Foobar2000 ~ DADA Automatic Song Rating
Date and duration adjusted (DADA) auto-rating algorithm for foobar2000
The DADA Auto-Rating algorithm (DAR) automatically rates music according to a variety of statistics collected by foobar2000’s official “playback statistics” plugin.If done well, an auto-rating algorithm will simply tell you what your favorite (and conversely, least favorite) music is, and the rating will be derived from and reflect actual listening behavior. This is quite different from manual ratings (e.g. 1 – 5 stars set by the user), since there’s very often a disparity between what we’d like ourselves to like, and what we actually like. For those interested in uncovering their actual musical tastes, a good auto-rating formula can be quite illuminating.
www.giantpygmy.net/studio/?post=dada-music-auto-rating-algorithm-foobar2000
Hydrogen Audio Discussion
Share this:

MilkDrop ~ Audio Visualization Plugin
MilkDrop is a music visualizer – a “plug-in” or extension to Winamp or Foobar2000 music players. As you listen your music in Winamp, MilkDrop takes you flying through the actual sound waves you’re hearing, and uses beat detection to trigger myriad psychedelic effects, creating a rich visual journey through sound. MilkDrop can also be driven by a live audio feed (microphone or line-in).
www.geisswerks.com/milkdrop
sourceforge.net/projects/milkdrop2
en.wikipedia.org/wiki/MilkDrop

