foo_vis_wispan ~ Winamp Spectrum Analyzer


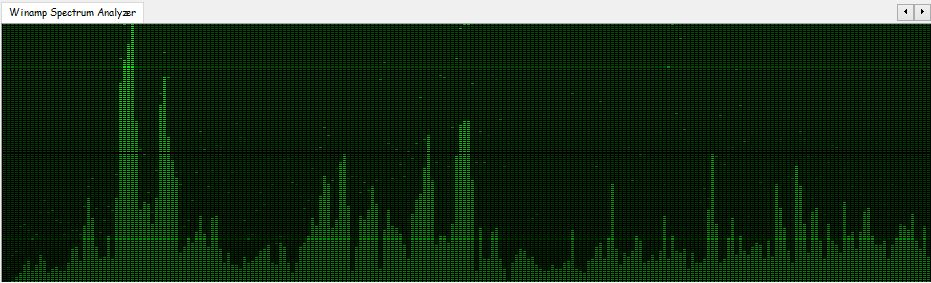
foo_vis_wispan is a Foobar2000 spectrum analyzer visualization implemented with GDI. It is a port of the Classic Spectrum Analyzer (vis_classic) Winamp visualization plug-in by Mike Lynch.

Features:

  • Accurate, detailed, customizable spectrum analyzer.
  • vis_classic library has been upgraded to compile with a modern toolset.
    • Upgraded the resolution of the waveform passed into the library from 8 bits to 16 bits.
    • Other changes are mainly to integrate with foobar2000 instead of Winamp.
    • That means bugs in the original are still likely to be present.
  • Options can be modified and their effects viewed in real-time as the component is running.
  • Compatible with the Default User Interface (Default UI) and the Columns User Interface (Columns UI).
  • Tested on foobar2000 v2.25.3 (x86 32-bit and x86 64-bit) and Microsoft Windows 11 (Build 26200).

www.foobar2000.org/components/view/foo_vis_wispan
wiki.hydrogenaudio.org/…/Foobar2000_visualization_components

foobar2000 ~ foo_vis_spectrum_analyzer


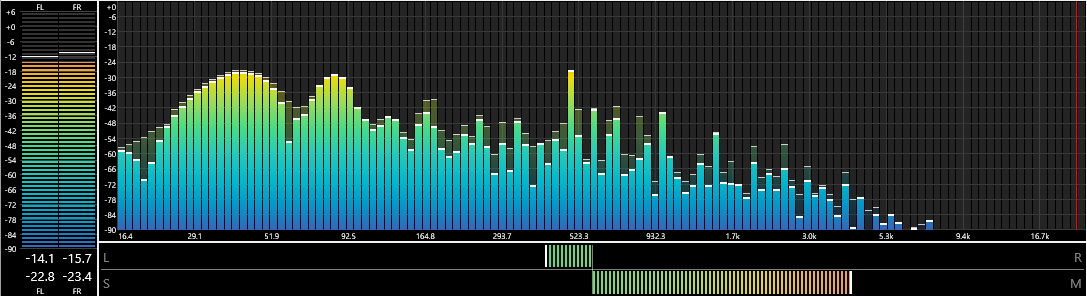
foo_vis_spectrum_analyzer is a foobar2000 component that implements a spectrum analyzer panel. It is an attempt to recreate the foo_musical_spectrum component by fismineur for foobar2000 64-bit.

hydrogenaudio.org/index.php/topic,125031.0
www.foobar2000.org/components/view/foo_vis_spectrum_analyzer
github.com/stuerp/foo_vis_spectrum_analyzer

sndpeek ~ Realtime Audio Visualizer


sndpeek is just what it sounds (and looks) like:

  • real-time 3D animated display/playback
  • can use mic-input or wav/aiff/snd/raw/mat file (with playback)
  • time-domain waveform
  • FFT magnitude spectrum
  • 3D waterfall plot
  • lissajous! (interchannel correlation)
  • rotatable and scalable display
  • freeze frame! (for didactic purposes)
  • real-time spectral feature extraction (centroid, rms, flux, rolloff)
  • available on MacOS X, Linux, and Windows under GPL
  • part of the sndtools distribution.

www.gewang.com/software/sndpeek
soundlab.cs.princeton.edu/software/sndpeek
www.cs.princeton.edu/sound/software/sndpeek/look

audioMotion ~ Player & Realtime Spectrum Analyzer


audioMotion is a media player and high-resolution real-time audio spectrum analyzer that allows you to SEE your music! ♪♫🤩

It is completely free, open-source software, created out of my passion for the graphic spectrum analyzers of hi-fi systems from the 1980s.

Features:

Dual channel high-resolution real-time audio spectrum analyzer

  • Media player with subtitles support for audio and video files
  • Fullscreen and Picture-In-Picture display at 60fps, ready for Retina / HiDPI screens
  • Logarithmic, linear and perceptual (Bark and Mel) frequency scales, with customizable range
  • Visualization of discrete FFT frequencies or up to 240 frequency bands (supports ANSI and equal-tempered octave bands)
  • Decibel and linear amplitude scales, with customizable sensitivity
  • Optional A, B, C, D and ITU-R 468 weighting filters
  • Optional effects: vintage LEDs, variable opacity, mirroring and reflection, radial spectrum
  • 17 beautiful color gradients, plus a visual editor to easily create your own gradients
  • Support for M3U playlists (.m3u and .m3u8 file extensions)
  • Visualize audio from your microphone (or “stereo mix”, if your soundcard supports it)

audiomotion.app
github.com/hvianna/audioMotion.js

GLava ~ OpenGL Audio Spectrum Visualizer


GLava is a general-purpose, highly configurable OpenGL audio spectrum visualizer for X11.

github.com/jarcode-foss/glava

Cava ~ Cross-platform Audio Visualizer


Cava is a bar spectrum audio visualizer for terminal or desktop (SDL).

Cava works on:

  • Linux
  • FreeBSD
  • macOS
  • Windows

This program is not intended for scientific use. It’s written to look responsive and aesthetic when used to visualize music.

github.com/karlstav/cava
Cavalier ~ Visualize Audio With CAVA

Online Spectrum Analyzer & Spectrogram Using Custom FFT


MAnalyzer ~ Normalizing Spectral Analyzer & Sonogram


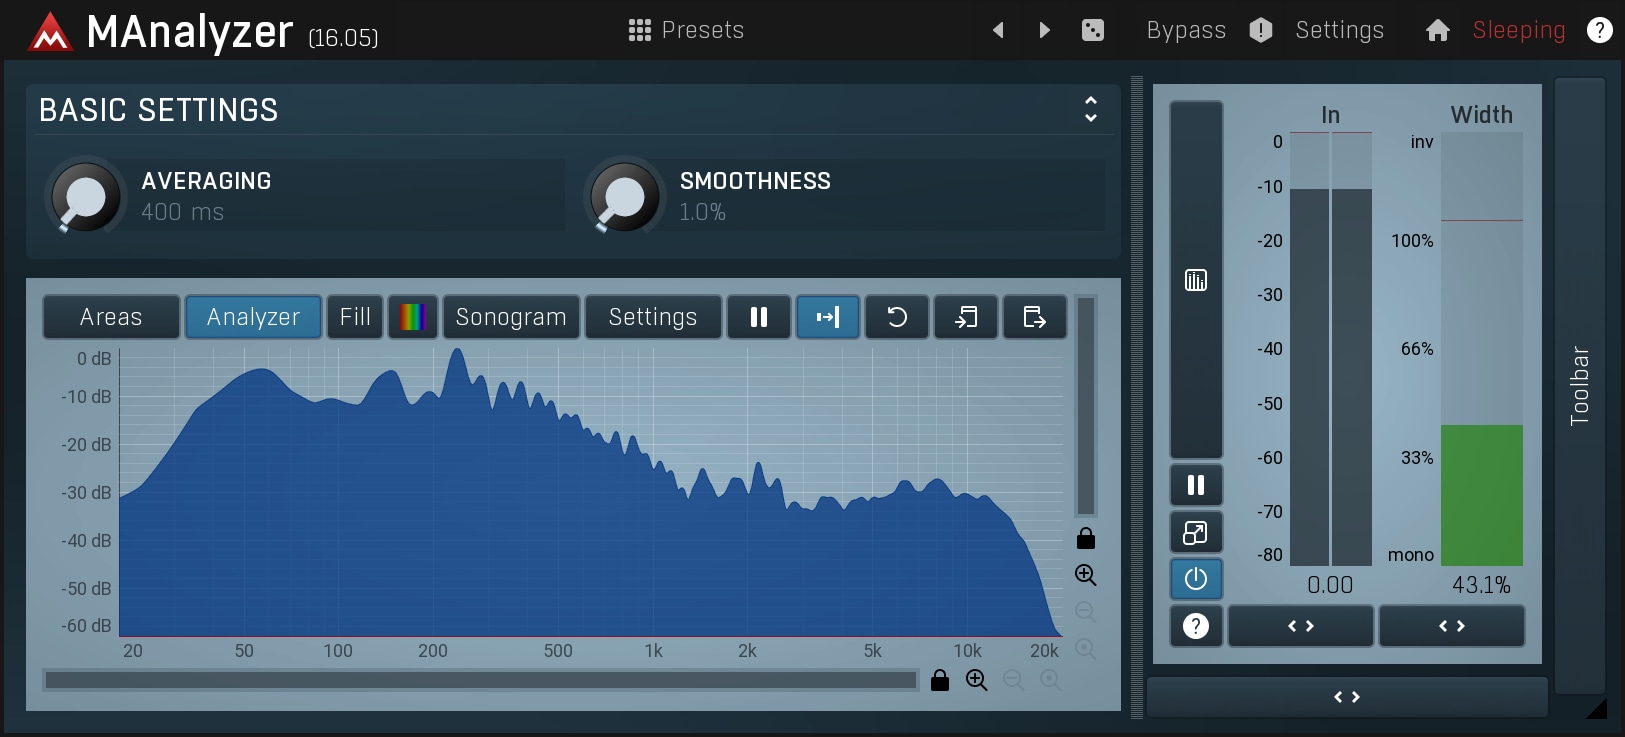
MAnalyzer is an advanced spectral analyzer and sonogram plugin containing unique features such as smoothing, normalization, super-resolution, prefiltering and deharmonization. The included meters provide a peak meter and EBU R128 and ITU-R BS 1770-3 compliant loudness meter.

www.meldaproduction.com/MAnalyzer

SpectrumViewer ~ Windows Continuous Spectrum Display


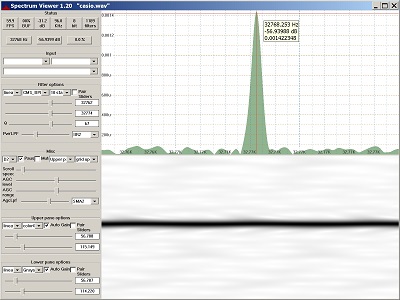
Display of audio spectrum from PC input or wave file.

Reads audio from Windows audio interface or wave file and creates a continuous spectrum display. Command line support for generating sine, square, triangle and sawtooth wave files. Uses biquad IIR digital filters for frequency detection, plus digital lowpass filters for smoothing. Highly configurable. 60+ FPS with suitable hardware. Manual or automatic gain control.

Features:

  • Continuous display update
  • Single function, easy to learn
  • Zoom in on small frequency or dB range
  • Resizable main window and repartitionable panes
  • Crosshair cursor when Ctrl is pressed
  • Single, stand-alone exe file, no install/uninstall
  • Builds with Visual Studio 2019 or 2022
  • Bit-perfect sine wave generation for all sample sizes

sourceforge.net/projects/spectrumviewer-for-windows

Accessible Spectrum Analyser ~ Inspect Spectrograms Via Sonification


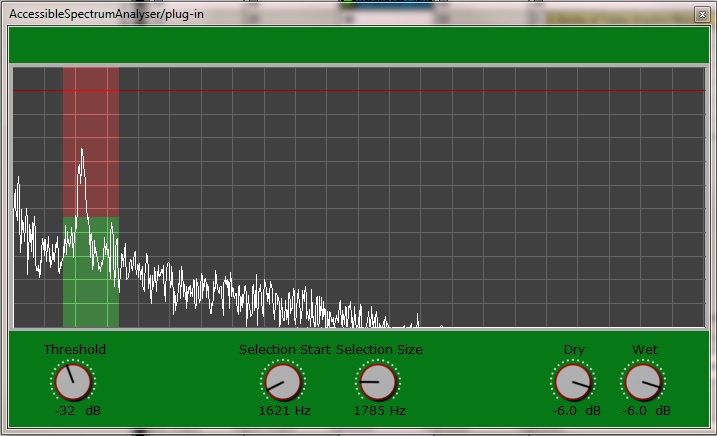
AccessibleSpectrumAnalyser is a real time spectrum analysis plug-in that allows visual impaired users to  as the accessible peak meter. Instead of monitoring the amplitude of the audio signal though, you will be monitoring the frequency components of the signal within a customizable selection of frequencies.

The plug-in uses the “clipping” sonification of the AccessiblePeakMeter. That is, you can set a threshold in dB and, as soon as the energy of any frequency in the selection goes past the threshold, you will hear a short beep. Like in the AccessiblePeakMeter, the beep starts at 440 Hz and it’s raised one semitone for each dB of difference between the frequency magnitude and the threshold. In case more than one frequency within the selection is higher than the threshold, then the highest one is taken into account for the sonification purpose.

There is only one single spectrum for both left and right channels: the two channels are mixed together before being analysed. In AccessiblePeakMeter, there is a separate sonification for peaks in the left and the right audio channel. In the AccessibleSpectrumAnalyser instead, one single sonification is panned from left to right and the panning represents the position of the peaking frequency in the whole spectrum, ranging from 20 Hz on the very left, to 20050 Hz on the very right. For example, if the selected spectrum peaks at 50 Hz then you’ll hear the beep towards the left, whereas if the peak is at 20 kHz the beep will occur towards the right.

depic.eecs.qmul.ac.uk/apm/spectrum
www.tbproaudio.de/products/accessiblemeters

LAoE ~ Multilayer Java Audio Editor


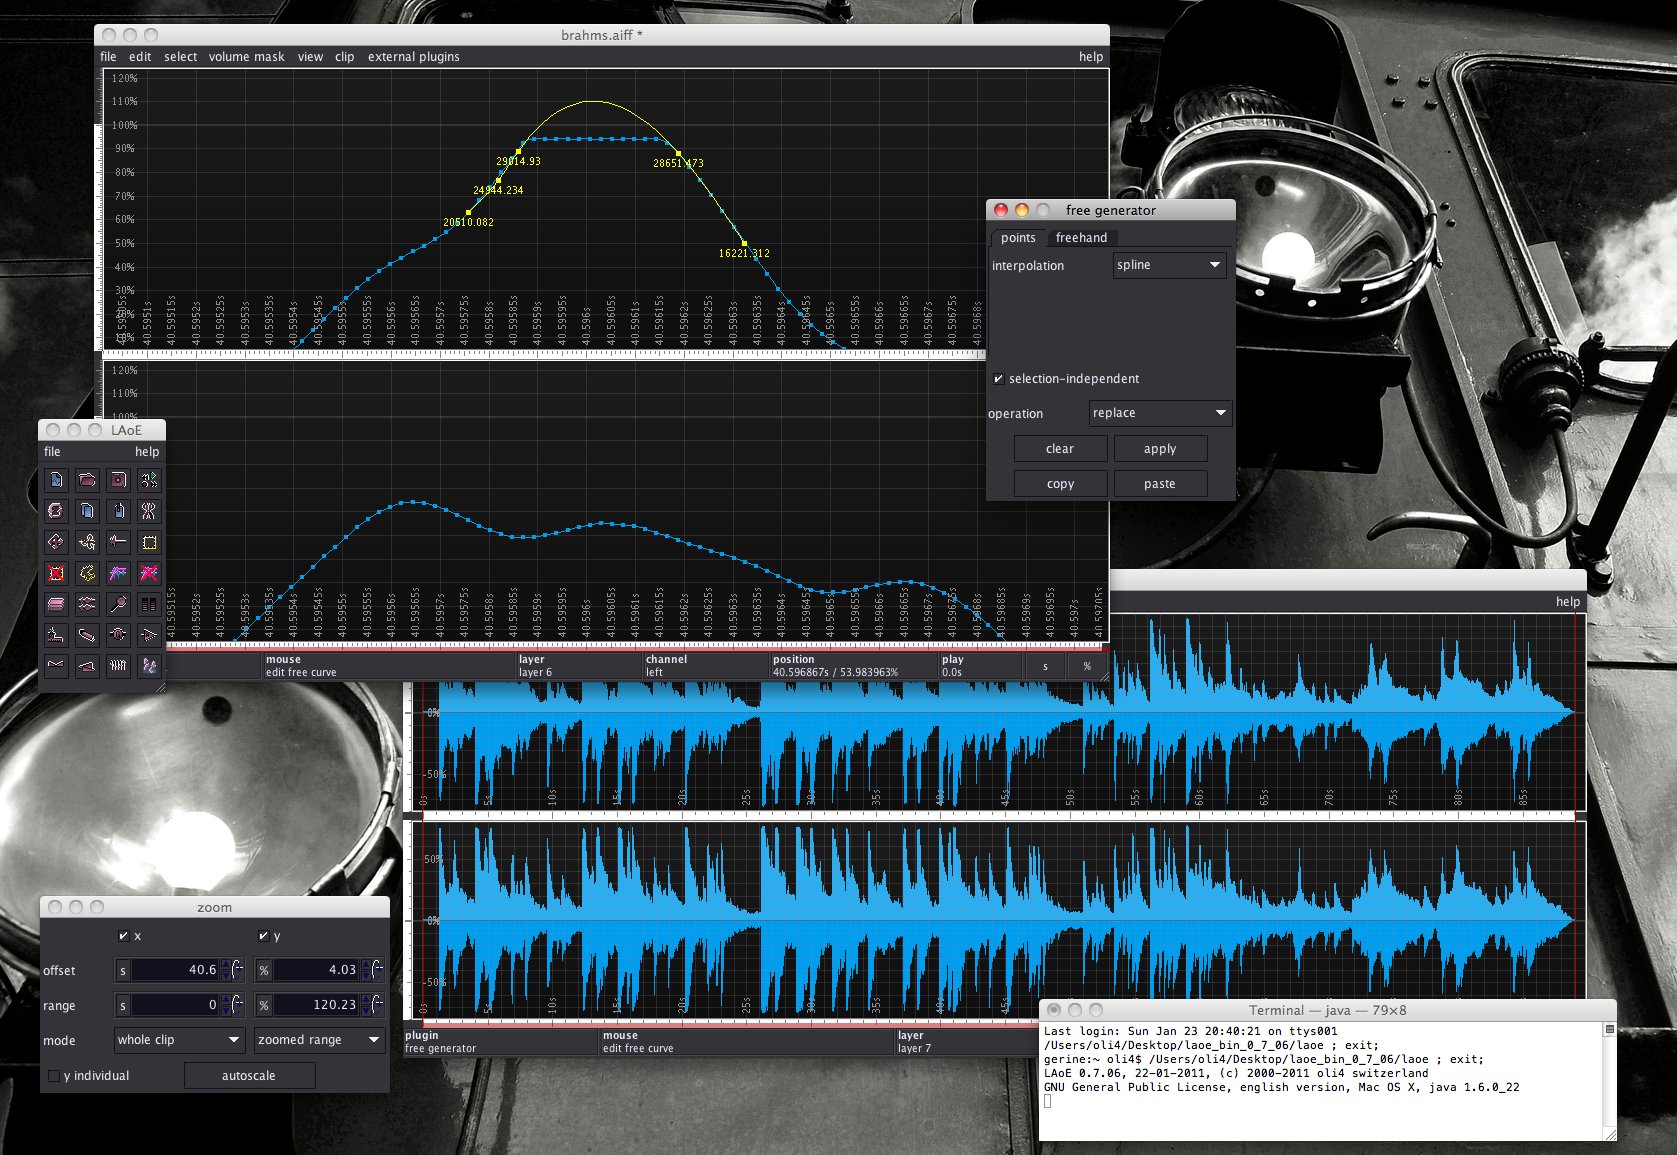
LAoE means Layer-based Audio Editor, and it is a rich featured graphical audio sample-editor, based on multi-layers, floating-point samples, volume-masks, variable selection-intensity, and many plugins suitable to manipulate sound, such as filtering, retouching, resampling, graphical spectrogram editing by brushes and rectangles, sample-curve editing by freehand-pen and spline and other interpolation curves, effects like reverb, echo, compress, expand, pitch-shift, time-stretch, and much more… And it is free of charge, under GPL license!

www.oli4.ch/laoe/home
sourceforge.net/projects/laoe

Beast ~ Linux Synthesizer & Music Creation


Beast is a digital synthesizer and music creation system, released as Free Software under the GNU LGPL-2.1+. It has support for Linux Audio Plugins (LADSPA), multi-track editing, unlimited undo, real-time synthesis, MIDI and various audio formats like WAV, AIFF, Vorbis, Soundfont 2, Gus Patch, FLAC and MP3 files, 32bit audio rendering, full duplex support, multi-core audio rendering, SIMD utilisation, precise timing at sample granularity, FFT spectrograms and MIDI automation. The project is translated into a variety of languages.

beast.testbit.eu

github.com/tim-janik/beast