A foobar2000 component that tracks and visualizes your music listening statistics on a monthly and yearly basis.
Features:
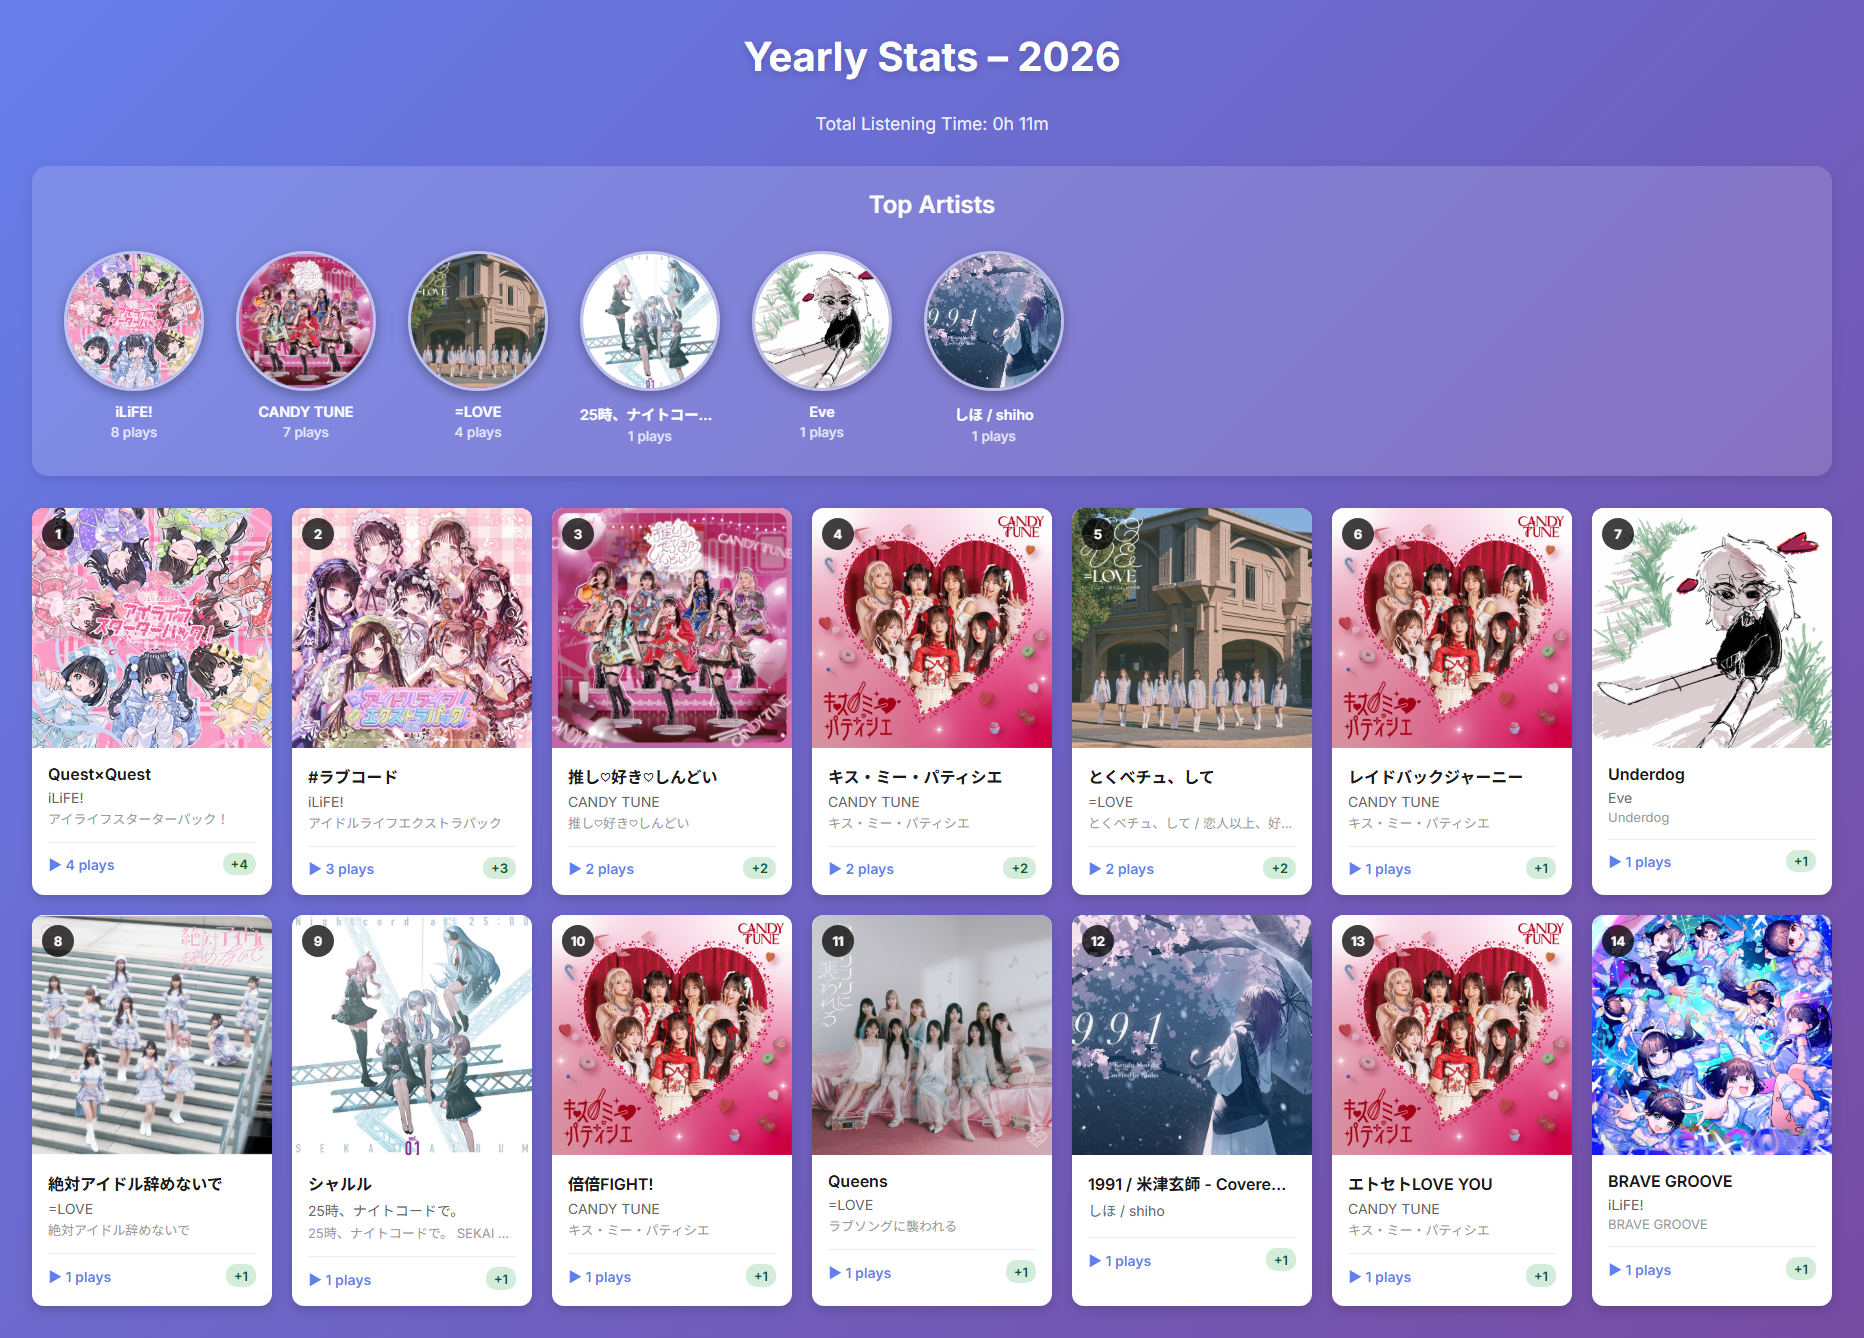
- 📊 Monthly & Yearly Statistics: View your listening history organized by month or year
- 🎵 Track Play Counts: Records the number of times each track is played with accurate playback time tracking
- 📈 Month-over-Month Comparison: See how your listening habits change with delta indicators
- 🎨 Beautiful HTML Reports: Export visually appealing reports with album artwork
- 🏆 Top Artists Ranking: Highlights your most-played artists with circular album art
- ⏱️ Total Listening Time: Calculates and displays your total listening time
- 🗄️ SQLite Database: Efficient local storage of listening history
- 🖼️ Album Art Integration: Displays album artwork in reports using embedded thumbnails
github.com/shirafukayayoi/foo_monthly_stats